

When you learn to ride a motorcycle, you’re told that your bike follows your eyes. Glance to the right and you drift right. Look left, move left. Where you place your attention has a great deal of force.
That is why getting your North Star Metric(s) right — the headline metrics around which every company priority is aligned — is so important. No matter which guiding metric a company picks, all energy and mental effort will pour into that direction. This can be extremely powerful — it has done wonders for companies such as Airbnb, Netflix, and Uber, particularly in the early days — but it can also be risky. If teams keep a single metric in their sights for too long, they can fall into short-term thinking, overlook fresh opportunities, and compromise the user experience. Below, I share data and case studies to offer lessons on how to narrow in on your own North Star Metric, when to widen your view, and when to change course.
In broad terms, there are six North Star Metric categories:
- Revenue (e.g. ARR, GMV): The dollar amount being produced — the priority for ~50% of companies. Customer growth (e.g. paid users, marketshare): The count of users who are paying — the priority for ~35% of companies. Consumption growth (e.g. messages sent, nights booked): The depth of product usage, beyond just visiting your site — the priority for ~30% of companies. Engagement growth (e.g. MAU, DAU) The count of users who are simply active inside your product — the priority for ~30% of companies. Growth efficiency (e.g. LTV/CAC, margins) The efficiency with which you spend versus earn money — the priority for ~10% of companies. User experience (e.g. NPS) The gauge of how pleasant and easy customers find the product experience overall — the priority for ~10% of companies.
So, what are the best North Star Metric(s) for startups? I surveyed current and former employees across more than 40 of today’s most successful growth-stage companies in order to build the table below; the results offer a useful framework for organizations looking for their own guiding metrics.
A framework for choosing your North Star Metric
The #1 question to start with: Which metric, if it were to increase today, would most accelerate my business’ flywheel? As you’ll see below, refining your ideal North Star Metric (NSM) — deciding which of the six categories above to focus on — depends heavily on your business model, how your product grows, and how your product is used.
Type of company: Marketplaces and platforms Most common North Star Metric: Consumption growth
Marketplaces and platforms earn money from usage — the more consumption they create on their platforms, the faster they expand. Marketplaces that take a share of each transaction, like Airbnb, Uber, Lyft, and Cameo, center their NSM on transaction volume (nights booked, rides taken, and orders placed, respectively).
Platforms that instead collect a flat fee per use, like the cloud communications platform Twilio and the fintech giant Plaid, highlight activity: in this case, messages sent and bank accounts linked. At first, it may look as if GMV would be the better target in both of these situations, but as I’ll explain below, using revenue as a NSM can mislead companies.
Type of company: Paid-growth driven businesses Most common North Star Metric: Growth efficiency
When performance marketing drives your business, there are two common NSMs: margins and LTV/CAC. Businesses such as meal kit service Blue Apron, ecommerce bedding company Casper, and telehealth startup Hims all obsess over improving margins because they sell a physical product with many cost layers. The more they earn per unit, the faster they grow.
Meanwhile, companies that are fully digital and put most of their budget into performance marketing, like the meditation and sleep app Calm, usually focus on LTV/CAC because most of their spend is directed toward digital ads. Some companies in this group also treat “payback period” as their NSM so they can optimize how fast they are able to reinvest in growth.
Type of company: Freemium team-based B2B products Most common North Star Metric: Engagement and/or customer growth
This group of products, which includes companies such as the collaborative online document startup Coda and Slack, grows through a bottom-up acquisition model. These businesses try to attract free users who then bring in their colleagues. Over time, once businesses hit a certain usage threshold, they move to a paid plan.
Depending on how mature the business is and how bottom-up its growth is at this stage, these companies either optimize for engagement (e.g. Coda uses “DAU14,” HubSpot uses “WAU”), paid customers (Airtable uses “Weekly Paid Seats” and Asana uses “Weekly Active Paid Users”), or paid teams (Slack uses “Number of Paid Teams,” while Dropbox uses “Teams using Dropbox Business”). The more mature and sales-led the product becomes, the more companies prioritize customers over engagement.
Type of company: UGC subscription-based products Most common North Star Metric: Consumption
For certain products driven by content creation, like Twitch and the video messaging platform Loom, it can be more effective to optimize consumption — say, five-minute plays, or videos created that are watched — rather than engagement. That is because sharing and consuming content sits at the center of their growth flywheel.
Although consumption and engagement are close metrics, the former is far more active — creating a video, for instance, instead of merely stopping by the site. Consumption is more likely to lead users to share the content, thereby powering the growth flywheel.
Type of company: Ad-driven businesses Most common North Star Metric: Engagement
Any company that monetizes via web traffic (by serving ads), such as Facebook, Pinterest, and Snap, chooses a North Star Metric built around engagement.
The question is whether the focus is on Daily Active Users (DAU), weekly (WAU), or monthly (MAU). Facebook and Snap aim at DAU because, for better or worse, social media is a daily routine for most people. Meanwhile, Pinterest looks at WAU, since it does not expect users to need the product every day. And Spotify’s podcast business concentrates on MAU, most likely because podcast listening is less regular for users.
Type of company: Consumer subscription products Most common North Star Metric: Engagement or customer growth
Consumer subscription products such as the language learning app Duolingo, dating app Tinder, and the exercise tracking app Strava tend to select either engagement or customer growth as their North Star Metric. Duolingo and Strava, for instance, both focus on engagement (e.g. DAU and MAU, respectively) because they have a large free-user base that eventually shifts to paid; therefore, the more active their free users are, the more they can expect to add paid customers.
Alternatively, companies like Tinder, Spotify, and Webflow focus on customer growth instead of engagement. Notably, Tinder tracks the share of paid accounts, not an absolute count. That’s because with so much organic churn — as people presumably meet their soulmates — they are far better served if early users upgrade quickly. Patreon discovered that expanding successful creators (by following the number of new creators earning above a set dollar threshold) was central to its early growth flywheel. Spotify, which has both a subscription business (music) and an ad-supported business (podcasts), emphasizes engagement, customer growth, and consumption.
Type of company: Products that stand out on experience Most common North Star Metric: User experience
Some products rise or fall entirely on user experience — how delightful, simple, and useful customers judge the product to be. For that reason, these companies use a quality-focused North Star Metric.
While Robinhood and Superhuman rely on net promoter scores (NPS) — which reveal how likely a user is to recommend a product — Duolingo looks at a metric it calls “learning competency” using the Common European Framework of Reference for Languages (CEFR), which is the international standard for measuring language ability. They do this because for their product experience, it makes sense to define language proficiency at different levels that match the user’s goals.
Other notable and unique North Star Metrics
Although most companies fit the six patterns described above, some are not so easily categorized — their North Star Metrics rely on business-model-specific factors. Shopify, for instance, centers on growing customers (i.e. “active merchants”) rather than consumption (the number of transactions). That’s because instead of only charging a take-rate, the company also collects a subscription fee. So, it seeks long-term supply growth paired with attractive recurring subscription revenue.
Patreon strives to drive awareness among potential users; breakout success stories are fuel for their growth. The platform uses a unique North Star Metric I’ll call activated supply, which translates to “number of creators making over a certain amount.” That’s most likely their key metric because these profitable creators drive their top-of-funnel growth.
Miro, the visual collaboration software, uses “number of collaborative boards” as its North Star Metric, which suggests that the heart of its growth strategy is inter-organization virality.
Likewise, Amplitude, a B2B subscription product, focuses on “Weekly Learning Users” — users who view and share more than three charts per week.
The well-known consumer subscription business Netflix measures consumption through “median view hours per month,” rather than customer growth. Why? Most likely it has found that usage intensity directly improves retention to the service.
There is also a meaningful difference between using paid users vs. active paid users as your North Star Metric. The project management software companies Asana and JIRA both highlight weekly active paid users, while companies like Airtable and Slack simply emphasize paid users. I suspect the distinction comes from recognizing that inactive paid users will soon churn. As a result, there is more value in tracking high-value paid users.
Using “jobs to be done” to determine your North Star Metric
Another way to choose your North Star Metric is to ask: What jobs are our users hiring our product to do? The “jobs-to-be-done” framework (originally coined by Clayton Christensen) centers on the task or progress a customer is trying to make in a particular situation, not just on “knowing your customer” or something similar. It is a method for identifying the force behind a given purchase or use and optimizing for that in a way competitors cannot or will not. In this case, the North Star Metric should measure what matters most when delivering the job to be done for the customer or user. For example:
Plaid’s job to be done: Link my bank account to an app I’m using Thus, prioritize “bank accounts linked.”
Miro’s job to be done: Collaborate with colleagues remotely Thus, target “collaborative boards” as a North Star Metric.
Twitch’s job to be done: Watch gamers play live Thus, focus on “five-minute plays,” the number of users who have watched a stream for five consecutive minutes or more.
Lyft’s job to be done: Get a quick ride someplace Thus, focus on “number of rides.”
So what about revenue as a North Star Metric?
Cash is king, the old saying goes — and roughly half the startups I surveyed put revenue at the center of their North Star Metric. Part of this is about being able to control your own fate as a venture-backed company. But is revenue the right North Star Metric?
Companies like Amplitude, Figma, Notion, Patreon, and Superhuman deliberately center revenue as a North Star Metric — whether ARR, GMV, or plain old revenue growth — while companies like Airbnb, Miro, Netflix, Tinder, and Spotify intentionally stay away from focusing on revenue. The reasons for this include:
- It’s volatile, and therefore difficult to operationalize. At Airbnb, for example, revenue was influenced by things like currency exchange rates, average lengths of stay, and host pricing choices. But by zeroing in on a metric one step removed, such as “nights booked,” teams could more directly see the effect of their work. Setting revenue targets too early can also drive poor decisions, such as spending too much time tuning pricing — or, for that matter, being reluctant to reduce pricing — which can damage long-term business growth. A revenue goal can also fail to energize the team. People often join companies to pursue a specific mission; rarely is that mission simply increasing revenue. Metrics one step removed, such as number of paid customers, are more motivating because teams can assume that a paid customer is getting value from the product, so the company (and therefore the employee) is creating value.
Of course, in the end everyone cares about revenue, but there are some good reasons not to make revenue growth your only North Star Metric. Rather than focusing exclusively on revenue as your north star, what is another metric that is a leading indicator of revenue, one that is easy to track and optimize operationally?
There’s typically only one North Star Metric
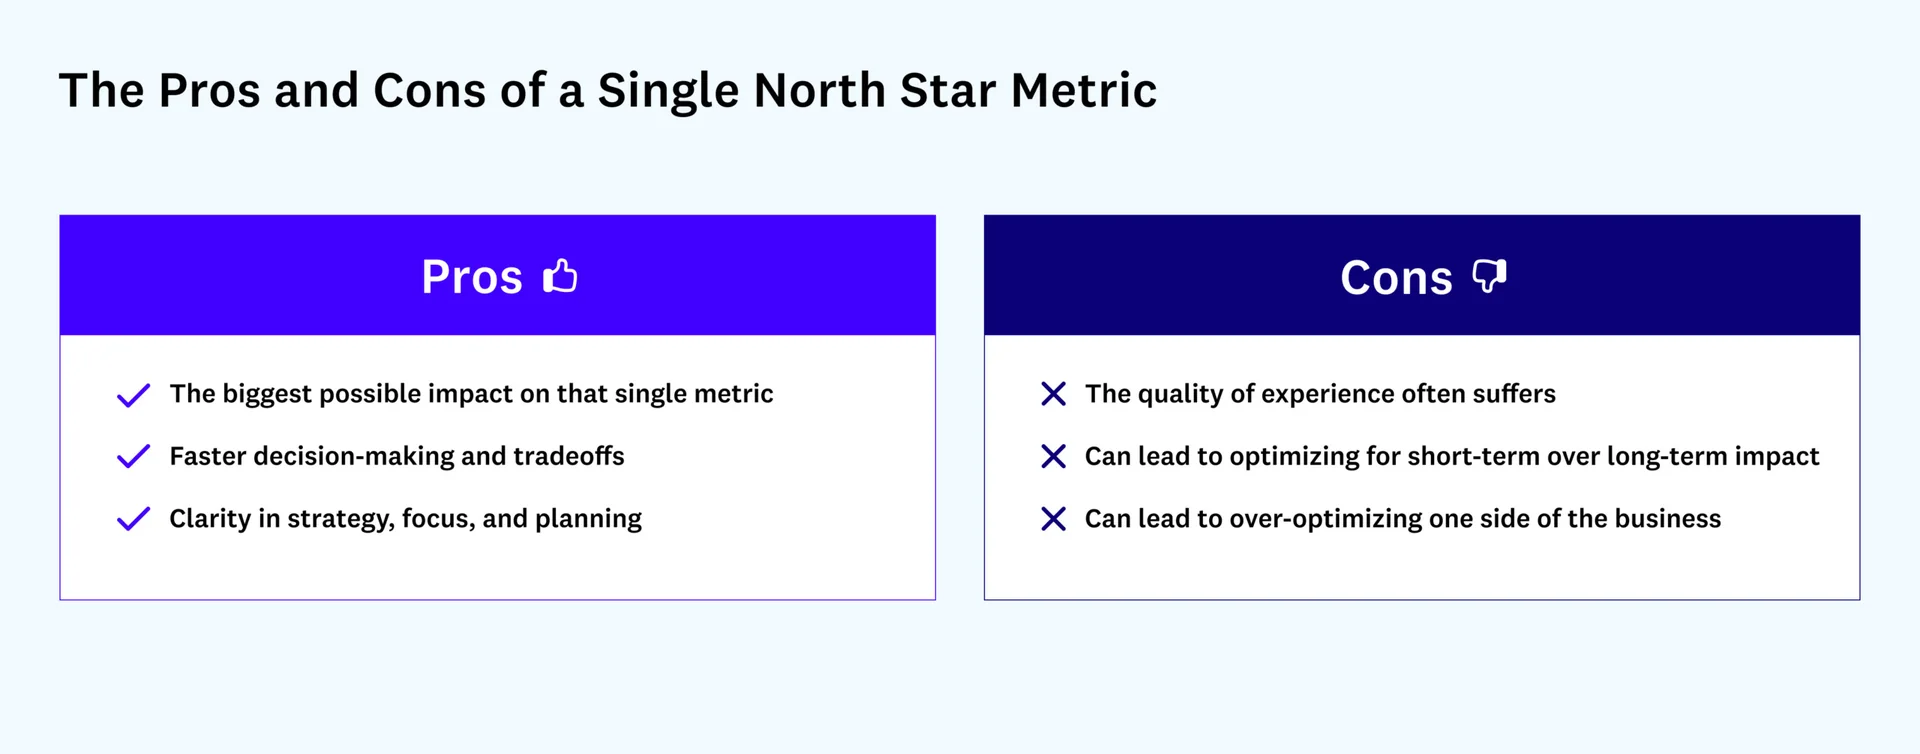
Some have warned against a single North Star Metric, arguing that you may overemphasize one part of the business and limit your growth. But most companies still align around one metric (especially if you leave revenue out), because it is the best way to create a meaningful impact. Having that single point of focus often produces a more unified company-wide planning and decision-making approach.
Companies that choose more than one North Star Metric usually do it only when they add a quality metric on top of the main one (for example, Superhuman, Slack, Duolingo), or when they run several products with separate objectives, as Spotify does with subscription music and paid podcasts, tracking customers, engagement, and consumption.
To get your output metrics right, tune your input metrics
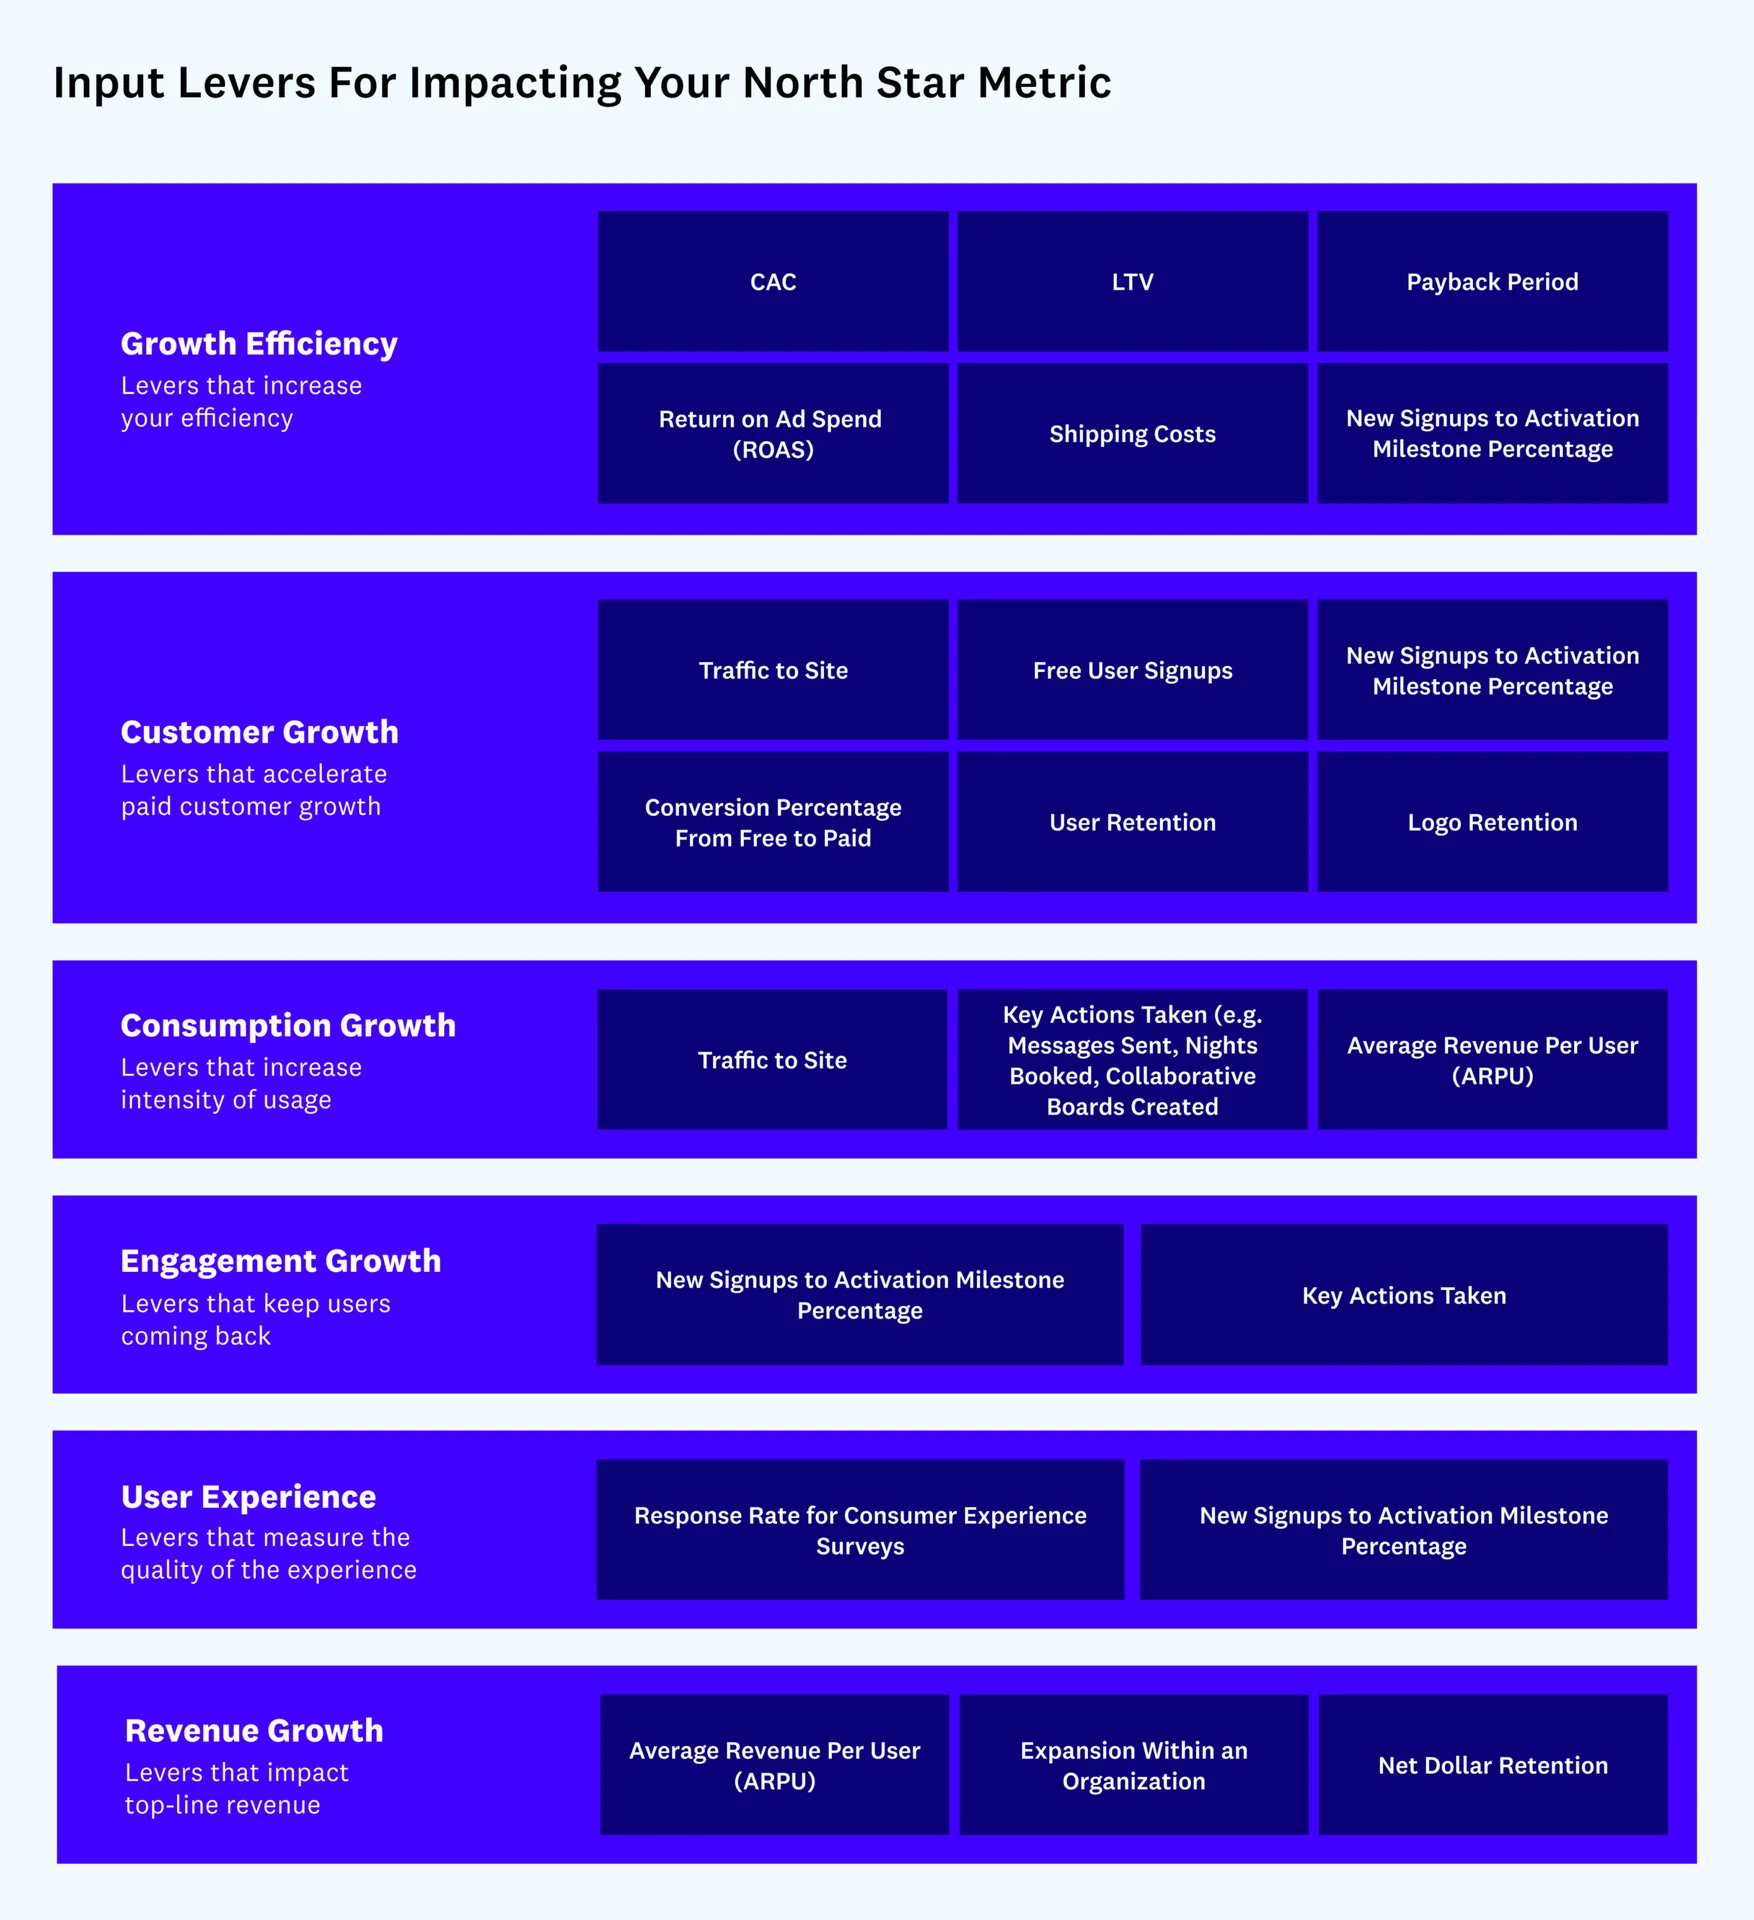
Seldom can you or your team directly, or by yourselves alone, influence a North Star Metric such as growing active users or increasing revenue. Instead, these measures are the result of the team’s daily work, such as improving flow conversion or sending more traffic to the site through additional Google ads. That is why they are known as output metrics and input metrics. After you define your North Star Metric, which is an output, the next move is to deconstruct it into its parts and choose which metrics, the inputs, are worth investing in.
When I worked at Airbnb, for instance, our North Star Metric was “nights booked.” It is not a metric you can readily build a roadmap around because it is too broad. Where would you even begin if you were trying to think of ideas to raise the number of trips people reserve? So we broke out the input metrics that contribute to this higher-level measure. For example, if you improve the guest conversion rate, add more Airbnb homes, or increase the number of visitors to the site, you will raise the number of nights booked. With input metrics that are that granular and actionable, you can actually generate concrete ideas and align teams around them as goals (for example, “Add 10,000 new homes to the platform in Q1”). At the same time, the whole company still had a higher-level North Star, into which each of these team efforts flowed.
Whenever you have a candidate for your North Star Metric(s), figure out which levers affect that metric, and then center your ideation on those input metrics. Here is a (non-exhaustive) set of input metrics for each of the six types of North Star Metrics I outlined above:
* * *
The companies I looked at in this post have all existed for many years. Even so, around a quarter of them told me that their North Star Metrics had recently changed, or were about to change. For instance, Dropbox centered on engagement (MAU) early on, then moved to paid customer growth as it shifted its business model from B2C to B2B. Figma and Uber stepped away from revenue as their NSM so they could double down on market share. Spotify turned its attention to consumption after it launched its podcasting business. Netflix has changed its NSM more times than people can count — at first it focused on the percentage of DVDs that reached customers the next day in the mail, later on the percentage of members who watched at least 15 minutes of streaming in a month, and more recently, on median view hours per month.
The examples above are growth-stage companies. In the earliest phase of a company, though, before you have found the fabled product-market-fit, your one goal should be to answer a single question: “Am I building something people want?” Rather than obsessing over revenue or customer growth or MAU, I suggest starting with “cohort retention” — are enough people staying after they use your product? If you cannot get people to stick around, nothing else will matter in the end. (You can read more about retention here.)
Lastly, regardless of the stage you are at as a startup or a company with a new product line, expect your North Star Metric to shift as your strategy changes. It will develop as you learn more about what keeps your team focused, motivated, and building toward the ultimate vision. Your North Star Metric is your strategy, and your strategy is your North Star Metric. Choose wisely.