

Momentum, from an investment perspective, is not a new phenomenon. Since the earliest days of markets, investors have sought to jump on price trends, with the routine drudgery of analyzing fundamentals often taking a back seat.
What has changed is the sheer velocity of momentum, and the dizzying pace that accompanies perceptions of “hot” or “cold” in the marketplace. Trends that used to take years to develop now seem to take months; what used to take days now may take hours, or even seconds.
With new kinds of unpredictability emerging, how do we know whether a decline is merely a normal pause within a strong bull market, or the start of a major slide? Many of us have seen stocks fall for reasons unrelated to company developments, often because the broader market was under strain for some reason. Perhaps market participants were concerned about the Fed’s next move, or maybe they had simply become overly greedy, pushing shares to excessive valuations.
If the goal is to make sense of, or act on, bull markets and bear markets, we need to have a way to identify when long-term trends are changing.
One way to guard against being caught on the opposite side of a trend in a quickly changing environment is to apply mathematical indicators that can isolate breakouts and trend shifts, while reducing biases that are inherent to investor psychology. In this type of analysis, based on moving price averages, the focus is less on why the market should move up or down, and more on what the current market dynamics are, from a supply-and-demand perspective. In other words, not what the market should be doing, but what it’s actually doing, as a guide to how it might behave in the future.
Reducing the noise with technical analysis
Today there are more opportunities than ever for a decoupling of price from fundamentals. This is fueled in part by a combination of technologically enabled factors, including: 1) the revolution of social media, in which market players can talk up stocks, contributing to upside momentum behind some stocks that perhaps are not deserving from a fundamental perspective, and 2) the incoming generation of retail investors who have access to information and tools that previously were available only to institutional investors.
Technical indicators — based on moving averages of price — smooth out volatility and reduce the noise that characterizes the stock market. We can argue about the fundamental valuation of a company, but we cannot argue with whether its stock is above or below its moving averages.
That’s where MACD, or “moving average convergence-divergence” indicator, comes in. It was developed in the 1970s and is widely accepted by technical analysts as one of the best ways to identify prevailing trends. It is available on just about every charting platform, some free and others at a premium, most of which allow for revision of the indicator’s standard parameters.
The calculation of his trend-following tool is simple. The standard MACD consists of a spread between the 12-period and 26-period exponential moving averages of closing prices for the security in question, which is then smoothed by a signal-generating line derived from the 9-period exponential moving average of the spread.
A long-term trend-following overlay comes from applying MACD to the monthly bar chart of the SPX. It offers a visual measure of the primary trend, rising and falling with it, and it marks major turning points when the two MACD lines cross. Those crossovers create “buy” and “sell” signals that may more clearly show when the long-term trend has changed.
To show this, look at the chart below, which goes back to 1999. The price bars are shaded green to indicate positive or improving MACD readings, and red to indicate negative or deteriorating MACD readings. Bullish and bearish crossovers, or MACD “buy” and “sell” signals, are marked with up and down arrows.
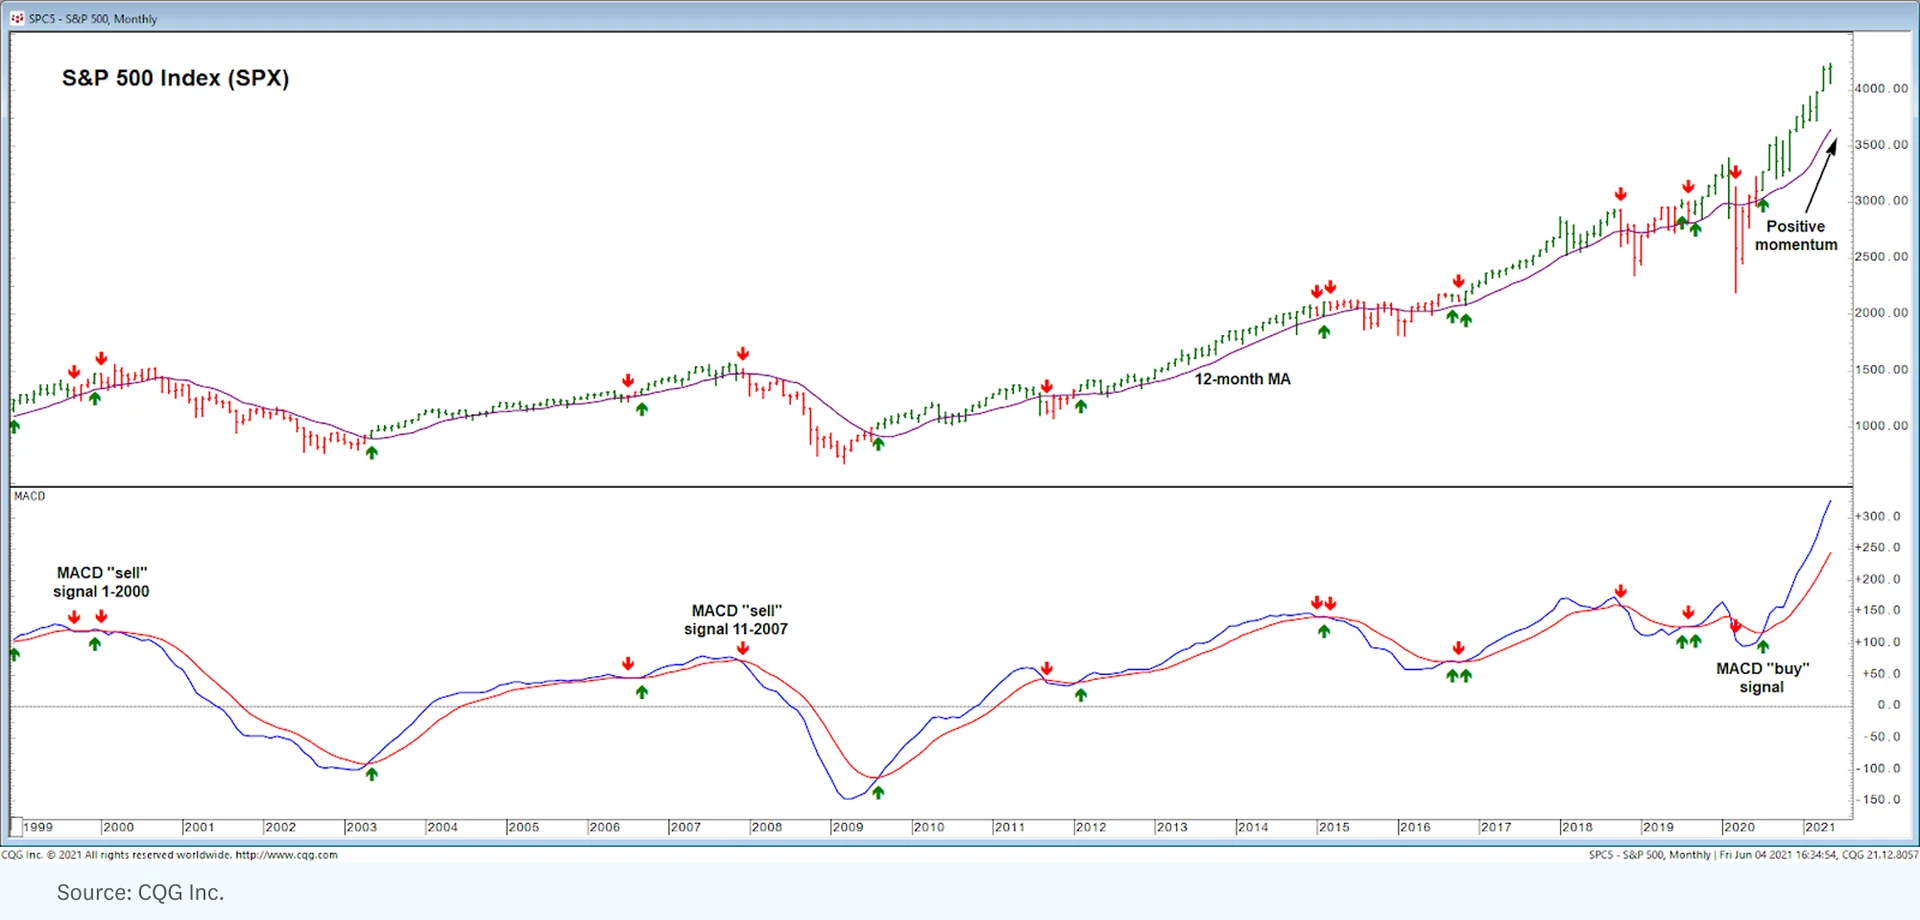
Generally speaking, it has been good to be long equities when the bars are colored green, demand is overwhelming supply, and the SPX usually maintains an uptrend. It tends to be a more difficult environment for investors when the bars are colored red, when demand is being met or exceeded by supply, and the SPX usually trends sideways or lower.
Making it easy to avoid bear markets
Technical analysis has existed for more than a hundred years, but 2008 was when the discipline seemed to truly build a following on Wall Street. The SPX’s monthly MACD issued a “sell” signal in November 2007, one month before the breakdown, and it did not issue a “buy” signal until several months after the March 2009 low. The bearish reversal surprised many portfolio managers, but those who relied on trend-following indicators such as MACD were faster to cut exposure and suffered less damage to their portfolios. That drew attention to technical analysis as a practical risk-management discipline.
MACD “buy” and “sell” signals are often delayed, appearing after reversals because the indicator is built from moving averages that look back at price history. Even so, the signals are not too late to benefit from long-term reversals, and at times they even come before bear markets, as in 2000 and 2007. Note that MACD flashed a “sell” signal in January 2000, before the tech bubble burst, and did not switch to a “buy” signal until May 2003, before a durable bull market advance began. Whipsaws are fairly common, but they are brief and often tied to changing trends such as in 1999 and 2015, so even false signals can be useful. Most of the uptrends and downtrends were captured by MACD despite its built-in lag.
Bear markets can emerge suddenly, or after distributive stretches that resemble trading ranges. In either case, the monthly MACD indicator can show when the market is likely in the grip of a bear market, or a long-term corrective phase like 2015-2016. It is not a trading system, so a “sell” signal should not be read as a reason to shift a portfolio to 100% cash, but rather as a sign that positioning should become more defensive.
Traders often sharpen long-term MACDs with shorter-term MACDs, assessing them together with other technical indicators that gauge momentum and overbought/oversold conditions for a broader picture.
Because technical analysis rests on concrete data, analysts widely agree on the value of MACD, even though they may prefer different parameters and time frames.
There are also alternative methods of measuring trends and momentum — for example, simpler moving-averages indicators that do not include a convergence-divergence element, or the Ichimoku system that displays support, resistance, and other trend data. These are often used in conjunction with MACD, for affirmation, and are not viewed as competing systems.
The new generation of investors likely will have increased options to navigate momentum in fast-moving markets. Tools on the horizon will leverage technology to not only access indicators, but to manipulate them and combine them in unique ways to build and test trading systems.
***
So what does MACD tell us about the current environment? As it stands, the SPX is very much in a bull market, according to the monthly MACD. A “buy” signal unfolded in July 2020 after a “V” bottom was established in March 2020 associated with COVID-19. The speed of the recovery rally made the crossover late, but not too late, particularly when enhanced by daily and weekly MACDs. Since the end of July 2020, the SPX has added another 30%, hitting a record high. The MACD continues to support a positive view of long-term momentum, and the two lines that comprise the MACD are still diverging, telling us to keep a bullish bias as we navigate the inevitable short-term swings.
The next monthly MACD “sell” signal on the SPX chart will deserve respect based on historical price action. It may not lead to a major bear market, but it would likely coincide with a more difficult trading environment. The top-down risk measure would alter our paradigm as it relates to individual stocks, with breakouts more likely to fail and breakdowns more likely to see downside follow-through. Overbought readings would create fear, while oversold readings would create healthy skepticism.
These psychological biases are what make a market a market, and they can be tempered by the impartial guidance of the MACD. Technological developments will continue to open markets to new kinds of investors, but those investors remain exposed to the same emotional forces that have always shaped trends. Fear and greed, too, make a market a market. Clear-eyed analysis of the underlying momentum can help us make sense of it all, even at top speed.